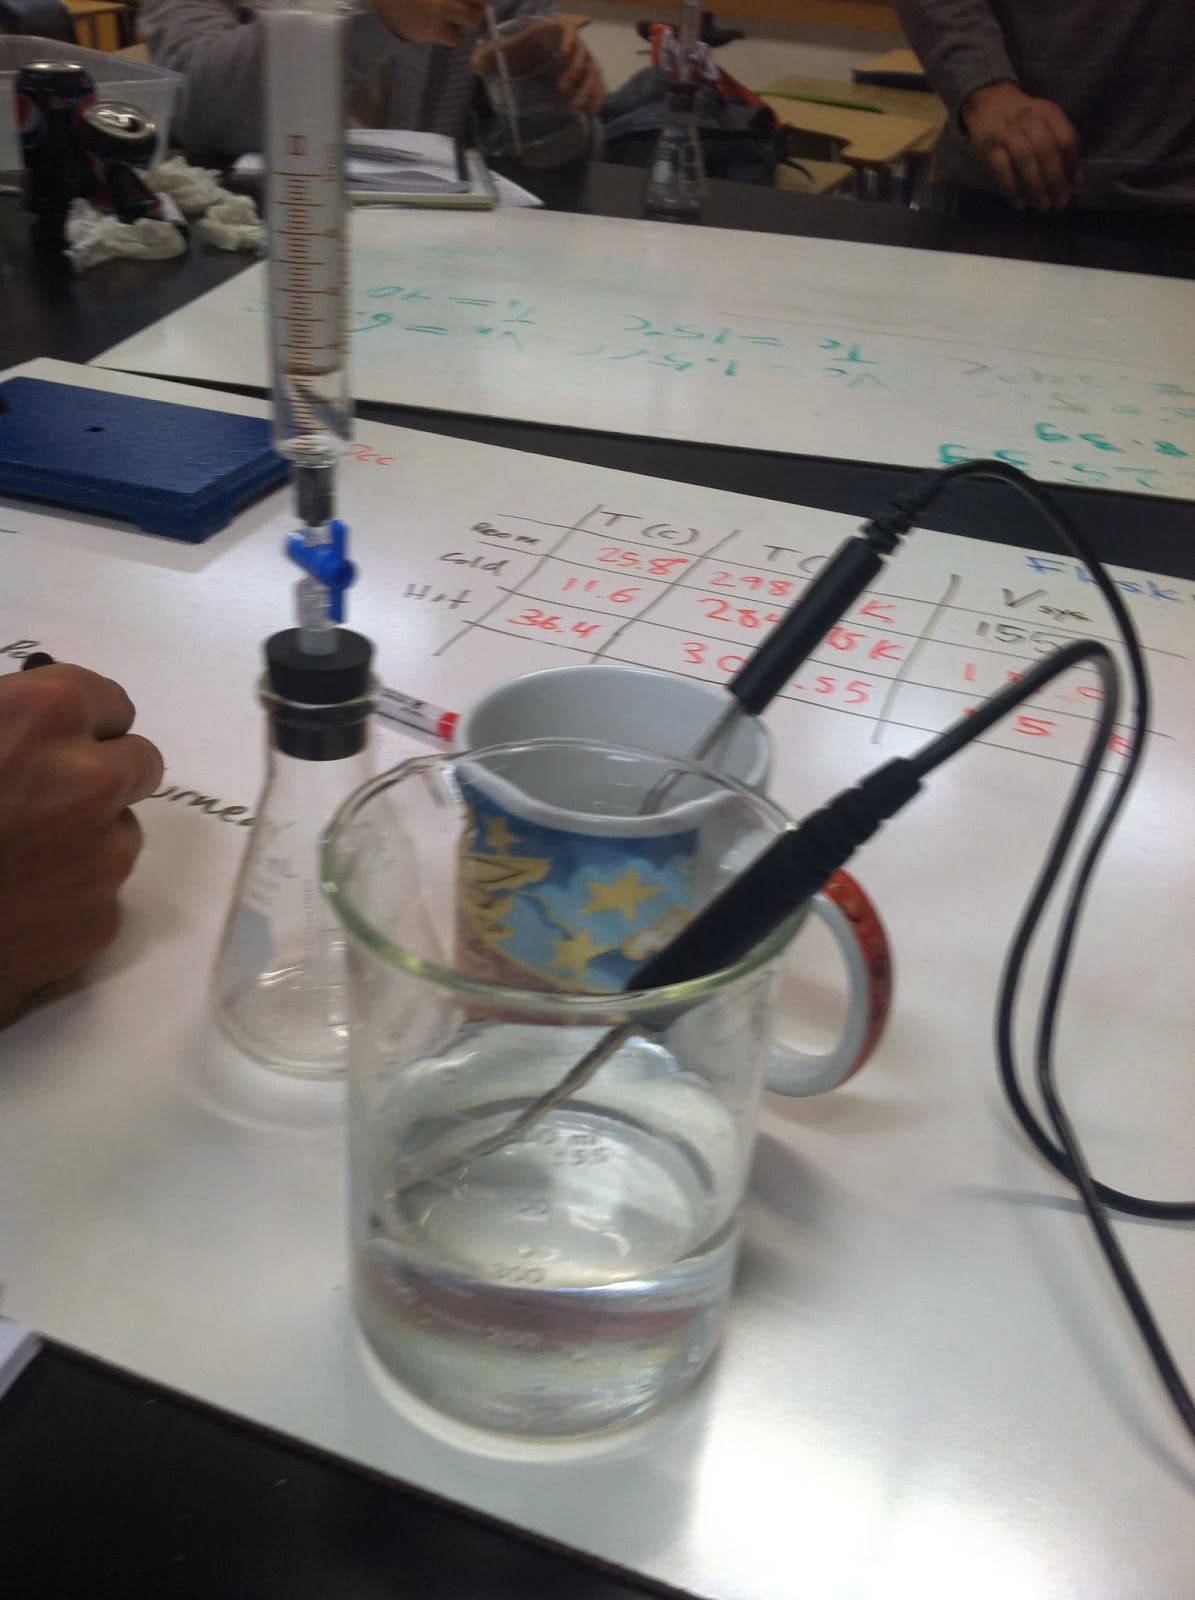
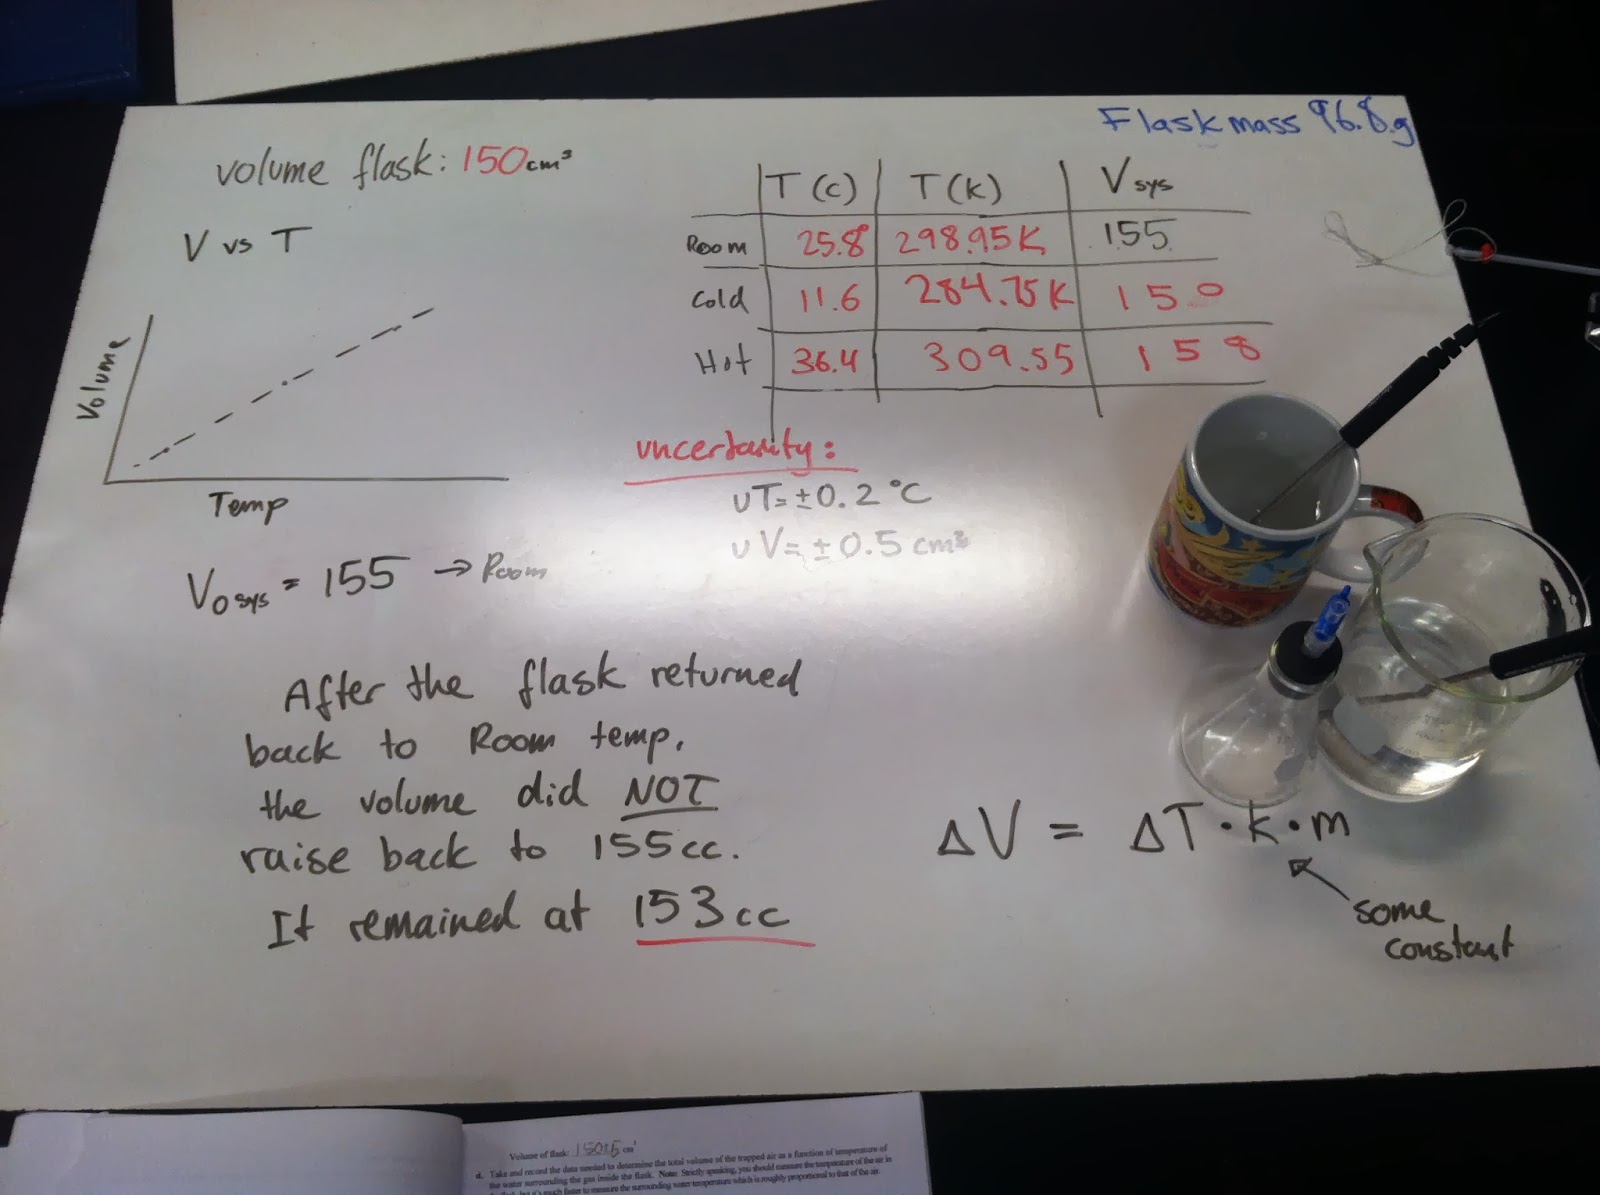
We utilized these devices to try and identify a relationship between temperature change and volume change.
We observed in our experiment with pressure being constant, as the temperature increased, so did the volume, likewise as the temperature decreased, so did the volume, thus giving evidence of a proportionality between the two measurements. V/T=nR/P with right side being constant
We graphed our data to confirm what we believed to be a proportionality between Temperature and volume at constant pressure. The slope V/T had units cm^3/ K and constant of 1/3, which displayed what we observed I our data table.
We did the experiments to observe the relationships and behaviors of various variables T,V, P under certain conditions. Observing the experiments, solving the equations, and plotting the graphs served to fully understand the important aspects of the gas laws specially ideal.


No comments:
Post a Comment